
Two-value resource utilization in the capacity view
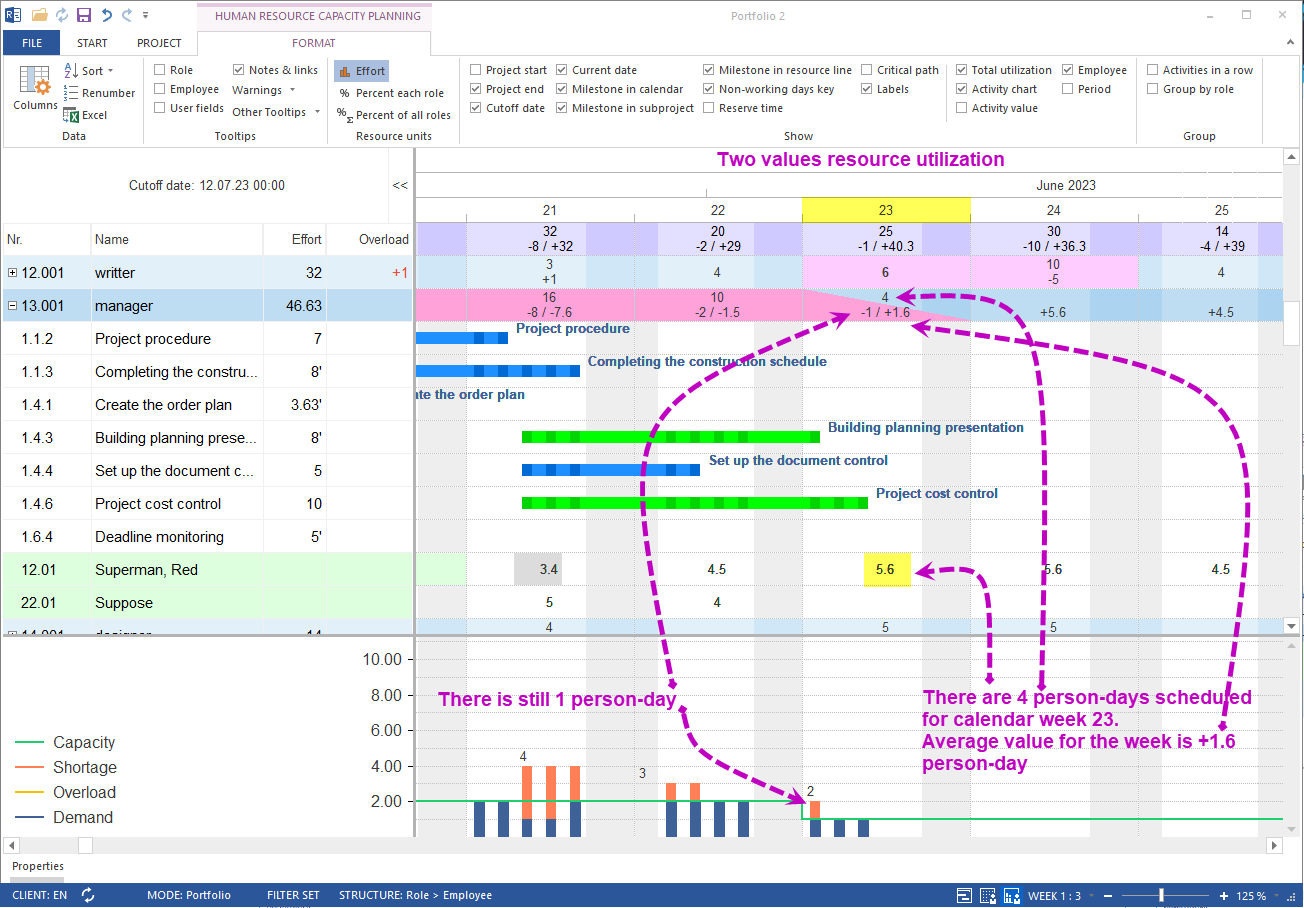
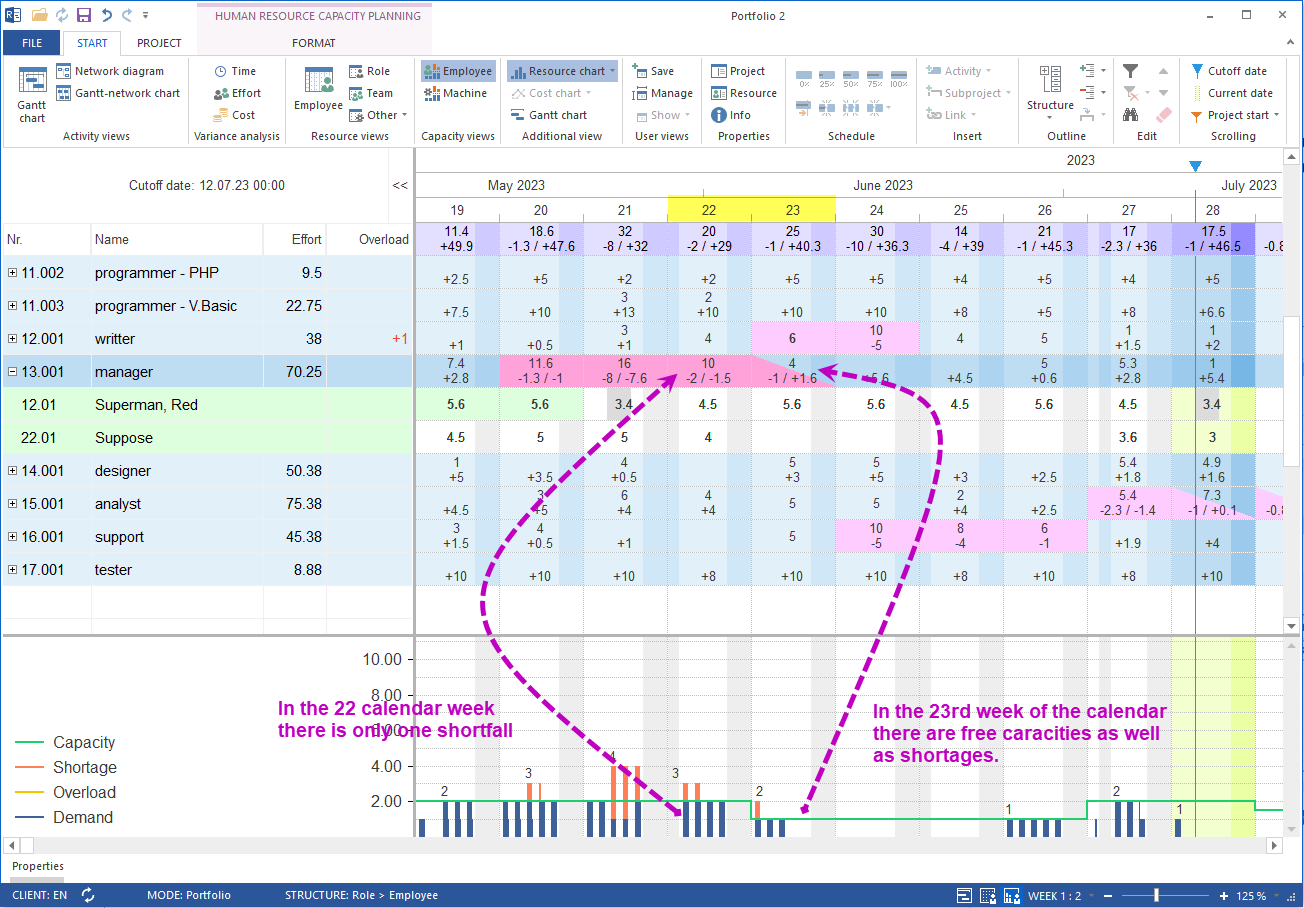
From Rillsoft Project 9 onwards the personnel capacity view displays two values simultaneously: the maximum resource shortage and the average resource coverage per time unit. Bottleneck and free capacity are therefore distinguishable – no netted average is hiding the problem any more.
How does demand and availability matching work?
In Rillsoft Project the professional skills of every employee are stored in the resource pool and matched against the requirements of the project activities. Personnel resources are then proposed based on qualification and taking working and non-working times into account. The personnel capacity view delivers the interactive overview.
What changed compared to Rillsoft Project 8
In older versions only one netted resource-demand value was displayed per time unit. Example:
- A calendar week has 2 person-days missing
- The same week has 1 person-day free
- Rillsoft Project 8: result -2 + 1 = -1 person-day for the whole week
This averaging logic hides the fact that a bottleneck and free capacity exist at the same time.
The two values in Rillsoft Project 9
| Value | Meaning | Example above |
|---|---|---|
| Maximum resource shortage | largest bottleneck inside the time unit | -2 person-days |
| Average resource coverage | free capacity inside the same time unit | +1 person-day |
The capacity view therefore shows -2/+1 person-days for a calendar week – both statements are immediately readable.
Practical benefit for workforce planning
- Bottleneck and reserve are visible at the same time
- Activities can be redistributed instead of overstaffed
- Decisions about overtime, subcontracting or rescheduling are data-driven
- The display also works across projects in the multi-project portfolio
Related to resource and capacity planning
- Capacity planning software – bottlenecks and free capacity across projects
- Staff scheduling software – plan employees by qualification and utilization
- Resource planning – manage personnel, machines and material centrally