
Percentage by professional qualification in the capacity view
The capacity view in Rillsoft Project 9 shows the percentage share of every professional qualification in resource utilization. This reveals which roles actually load the project portfolio and where the resource pool is structurally under- or over-dimensioned.
What is the percentage by professional role?
The percentage is a quantitative evaluation of skill-based capacity planning. From version 9 onwards, Rillsoft Project distinguishes two views:
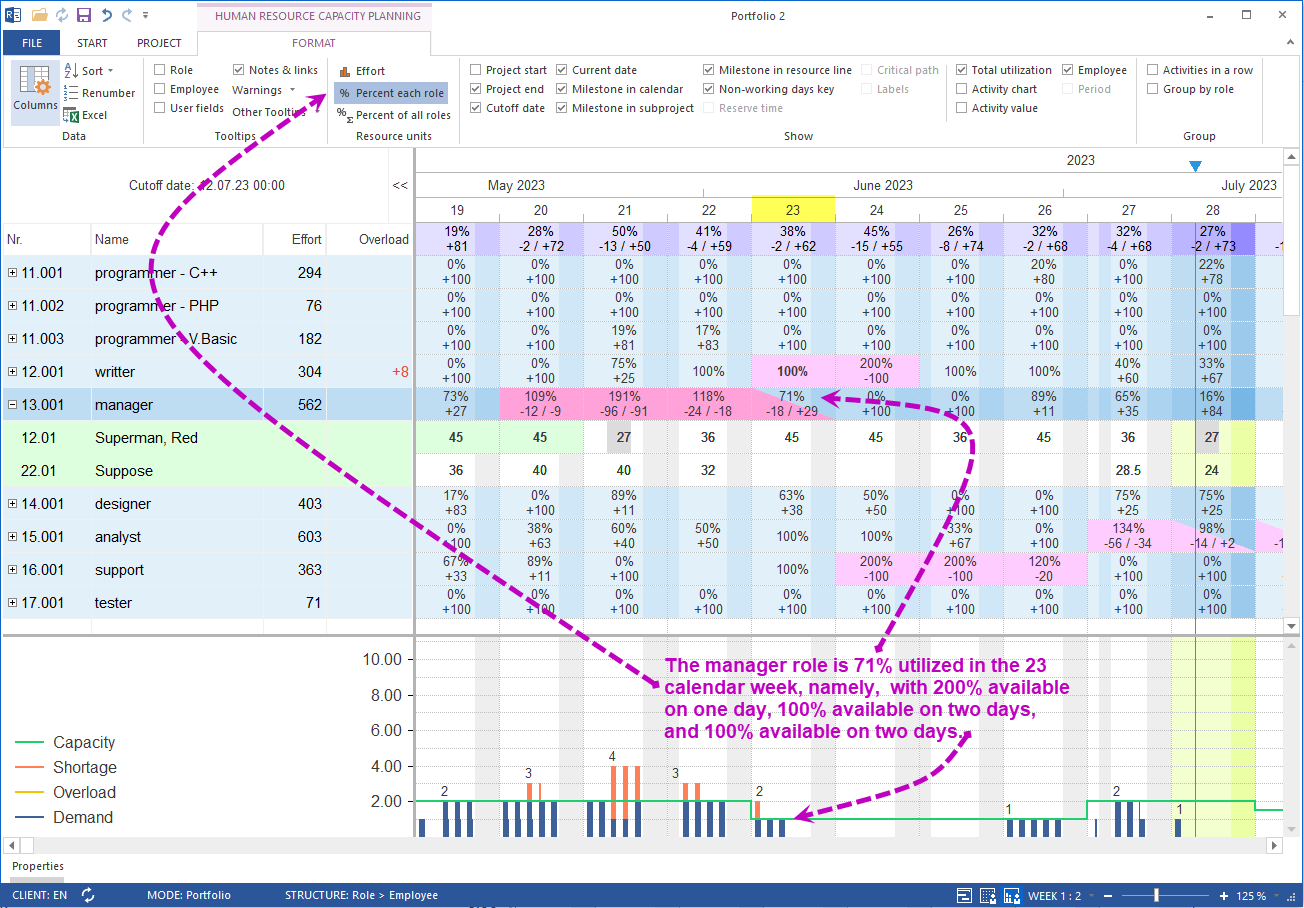
- Percentage per role – utilization of a single qualification against the resources available with that qualification
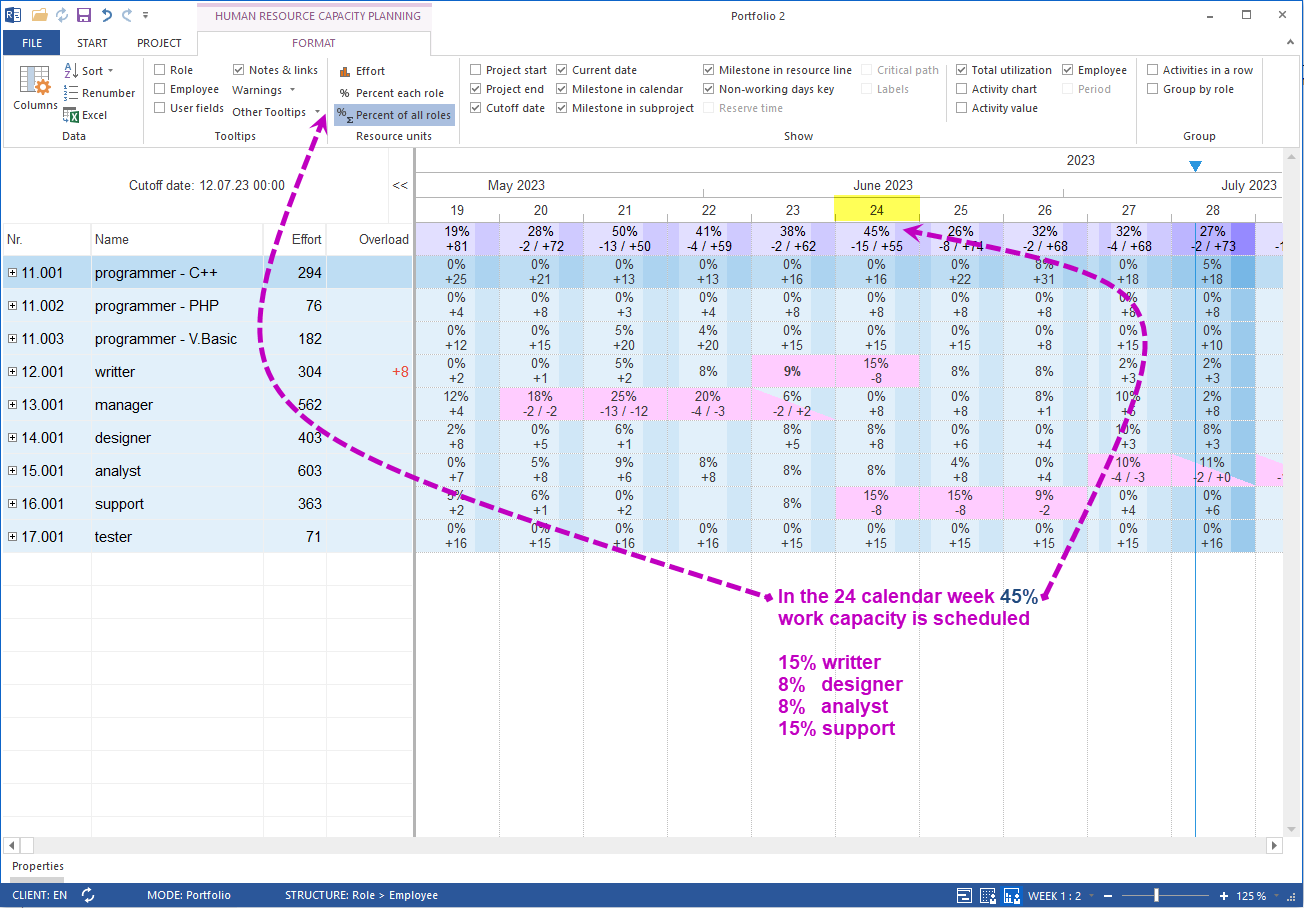
- Percentage of all roles – structural distribution of qualifications across the entire resource pool
New calculation algorithm in Rillsoft Project 9
| View | Formula | Statement |
|---|---|---|
| Percentage per role | (required resources of a qualification / available resources of that qualification) × 100 | Utilization of the single qualification |
| Percentage of all roles | (resources with a qualification / total resources) × 100 | Distribution of qualifications in the pool |
Existing skills and competences are first analyzed qualitatively and quantitatively. Utilization per role is then evaluated on top of that analysis.
Why the view by qualification is decisive
Excessive utilization of a single role is a bottleneck, even if the overall resource pool still shows reserves. With the percentage per role this bottleneck is visible early in the planning process – before specific employees are assigned. That keeps long-term capacity planning reliable.
The results provide a deeper view of how the distribution of qualifications affects project success and provide a solid basis for recruiting and training decisions.
Related to resource and capacity planning
- Capacity planning software – bottlenecks and free capacity across projects
- Resource planning – manage personnel, machines and qualifications centrally
- Multi-project management – plan multiple projects with a shared resource pool