
Gantt Charts in Project Planning: An Essential Tool for Success
A Gantt chart is a widely used and highly popular method for visually representing project plans and schedules. Originally developed by Henry L. Gantt in the early 20th century, Gantt charts have evolved over the years into an indispensable tool for project managers around the world. But what makes a Gantt chart so special, and why is it so prevalent in modern project planning?
What is a Gantt Chart?
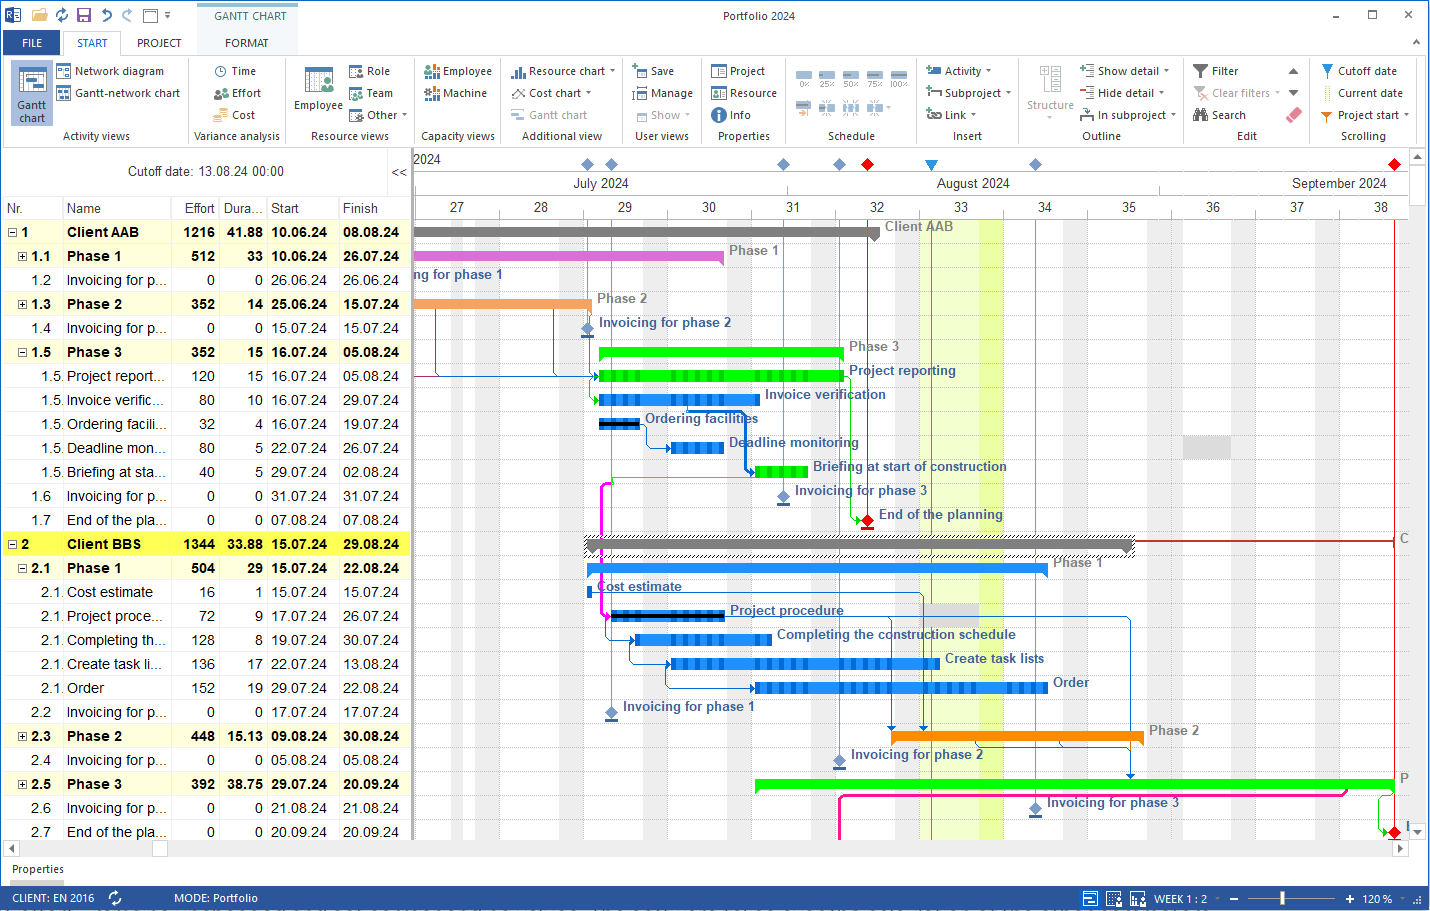
A Gantt chart is essentially a bar chart that graphically represents the timeline of a project. The horizontal axis displays time, while the vertical axis lists the various tasks or project phases. The length of a bar indicates the duration of a specific task, and the position of the bar shows the task’s start and end dates. Through this simple yet effective visualization, project stakeholders can immediately see which tasks run concurrently, which are dependent on each other, and how the overall project schedule is structured.
The Popularity and Widespread Use of Gantt Charts
The popularity of Gantt charts lies in their ability to present complex information in a clear and easily understandable way. Here are some reasons why Gantt charts are so widely adopted:
Clarity and Overview: Gantt charts provide a clear and organized view of projects, making it easier to monitor progress and identify potential issues early.
Visual Representation of Dependencies: By showing dependencies between tasks, Gantt charts make it immediately apparent which activities rely on each other and how delays can impact the overall schedule.
Flexibility: Gantt charts are easy to adjust, which is particularly important when project requirements change or unforeseen events occur.
Communication and Collaboration: Because Gantt charts are easy to interpret, they enhance communication among project stakeholders. They ensure that all team members, regardless of their role or technical expertise, have a unified view of the project status.
Time Management: The visual nature of Gantt charts helps project managers manage schedules more effectively by optimizing resource allocation and avoiding bottlenecks.
Gantt Charts in Practice: Rillsoft Project
Among the many software solutions offering Gantt charts, Rillsoft Project stands out with its versatile features and user-friendly design. Rillsoft Project provides efficient and intuitive tools for working with Gantt charts across various versions. The software enables users to easily create, visualize, and manage complex project plans.
A major advantage of Rillsoft Project is the ability to plan and monitor projects in real time. Users can quickly modify tasks, add new ones, and update existing plans while maintaining clarity—an essential factor in ensuring that all stakeholders stay informed and aligned.
In addition to paid versions, which offer extensive features for professional project managers, Rillsoft Project also offers a free version. This free version includes all the essential features for working with Gantt charts, allowing small teams and individual users to benefit from this powerful planning method. Thus, anyone—regardless of budget or project size—can harness the efficiency and clarity that Gantt charts provide.
Conclusion
Gantt charts are a powerful tool that has revolutionized the way projects are planned and executed. They offer a clear and structured visualization of complex project plans, enhance collaboration, and improve time management. With software solutions like Rillsoft Project—which provides both a free version and paid, feature-rich options—working with Gantt charts becomes an even more powerful and accessible tool for teams and projects of all sizes.